Call center performance metrics quantify service efficiency, operational consistency, and customer experience outcomes. These metrics serve as the foundation for performance evaluation, workforce planning, and quality assurance in contact center environments. By tracking defined indicators, organizations detect inefficiencies, benchmark service delivery, and improve agent performance.
This article analyzes eleven essential call center metrics: Average Handle Time (AHT), First Call Resolution (FCR), Customer Satisfaction Score (CSAT), Net Promoter Score (NPS), Abandonment Rate, Service Level, Call Volume, Call Quality Score, Agent Occupancy Rate, Cost per Contact, and Agent Turnover Rate. Each metric is defined with a calculation formula, industry benchmark, business impact assessment, and proven optimization strategy.
The article also provides supplementary analysis on the differences between metrics and Key Performance Indicators (KPIs), KPI categorization models, and the role of analytics tools in real-time performance tracking. It explores how structured measurement supports staffing, cost control, and customer retention while enabling long-term improvements through root cause analysis.
What are call center performance metrics and why do they matter?
Call center metrics evaluate operations across multiple functional dimensions. These metrics track efficiency, service quality, agent productivity, and customer satisfaction. Organizations use these metrics to monitor real-time performance, detect gaps, and support strategic decisions.
Metrics guide resource allocation by optimizing staffing, technology investments, and training budgets. They offer benchmarks to compare efficiency with industry and competitor standards. Consistent metric tracking ensures compliance with regulations and SLA contracts.
Performance metrics differ from Key Performance Indicators (KPIs) based on strategic focus. Operational metrics track contact center performance across all activities. Goal-based indicators measure progress toward business objectives. Organizations often define NPS and FCR as KPIs due to their link with retention and revenue.
Which call center metrics are essential for operational and customer success?
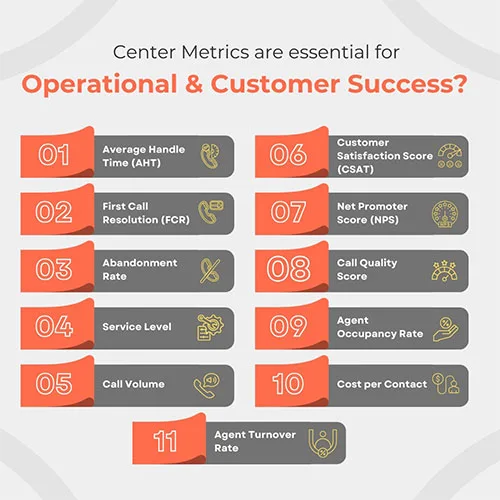
Call center metrics measure operational efficiency and customer experience across key performance areas. Metrics reveal contact center effectiveness and guide business decisions. Call centers track the following core metrics to evaluate performance consistently.
Operational efficiency metrics include Average Handle Time, Service Level, Call Volume, Agent Occupancy Rate, and Cost per Contact. Customer experience metrics include First Call Resolution, Customer Satisfaction Score, Net Promoter Score, Abandonment Rate, and Call Quality Score. Workforce stability metrics include Agent Turnover Rate and measures of consistent agent output.
1. Average Handle Time (AHT)
What is Average Handle Time (AHT)? Average Handle Time (AHT) measures the total time spent on a customer call, including talk time, hold duration, and after-call work.
How is AHT calculated? AHT = (Talk Time + Hold Time + After Call Work) / Total Calls
What are industry benchmarks for AHT?
Average Handle Time (AHT) varies based on industry complexity and call objectives.
- Technical support centers report AHT between 400–600 seconds due to multi-step troubleshooting procedures.
- Sales contact centers average 300–450 seconds, reflecting time spent on lead qualification, product explanation, and closing activities.
- Retail customer service teams operate within 240–360 seconds, addressing transactional inquiries and return requests.
- Healthcare contact centers often exceed 600 seconds, driven by patient data verification and interdepartmental coordination.
How does AHT impact business performance? AHT affects staffing needs, operational costs, and customer satisfaction. Higher AHT increases labor costs but may improve issue resolution. Lower AHT reduces costs but can reduce resolution quality.
What strategies improve AHT performance? Standardized scripts reduce variation and improve consistency. CRM optimization removes redundant data entry. Agent training improves problem-solving and product knowledge. These strategies improve both FCR and CSAT.
2. First Call Resolution (FCR)
What is First Call Resolution?
First Call Resolution (FCR) measures the percentage of customer inquiries resolved during the initial interaction. It excludes cases that require follow-up contacts for complete resolution.
How is FCR calculated?
FCR = (Calls Resolved on First Attempt / Total Calls) × 100
What are industry benchmarks for FCR?
First Call Resolution (FCR) rates differ by industry based on inquiry complexity and agent authority levels.
- Technology providers report FCR between 65–70% due to frequent technical escalations.
- Financial services achieve 75–80% through standardized procedures and advanced scripting.
- Healthcare contact centers range from 60–65% due to compliance constraints and case complexity.
- Public sector helpdesks operate near 60%, limited by identity verification steps and procedural routing.
How does FCR impact business performance?
FCR improves operational efficiency by reducing contact volume and enhances customer experience through faster resolution. Centers with 75% FCR manage 25% fewer repeat contacts than those at 60%, resulting in lower costs and stronger customer perception. Organizations with First Call Resolution rates above 75% experience up to 21% higher customer retention, according to the 2022 Zendesk CX Trends Report.
What strategies improve FCR performance?
Knowledge base systems provide instant access to resolution protocols and product data. Agent authority enables on-call decisions without escalation. IVR systems route inquiries to specialized agents. These improvements depend on coordinated investments in technology and training.
3. Abandonment Rate
What is Abandonment Rate?
Abandonment Rate measures the percentage of callers who disconnect before reaching an agent. It reflects service accessibility and customer wait-time tolerance.
How is Abandonment Rate calculated?
Abandonment Rate = (Abandoned Calls / Total Incoming Calls) × 100
What are industry benchmarks for Abandonment Rate?
Abandonment Rate reflects customer tolerance for wait time and service responsiveness.
- Emergency service lines maintain 2–3% abandonment due to regulatory enforcement and critical response requirements.
- Retail call centers average 6–10%, influenced by promotional surges and seasonal call spikes.
- B2B service desks operate within 3–5%, supported by scheduled appointments and call management systems.
- Telecommunications providers may exceed 8% during billing cycles or service outages.
How does Abandonment Rate impact business performance?
Higher abandonment rates reduce revenue opportunities and weaken service perception. Organizations with 8% abandonment rates lose more potential revenue than those at 3%. Tolerance levels vary by industry and call urgency, requiring sector-specific targets.
What strategies reduce Abandonment Rate?
Callback options reduce wait-time frustration while preserving access. Optimized staffing aligns agent availability with call volume. Queue position announcements and estimated wait times help manage expectations. These strategies depend on workforce systems and advanced telephony tools.
4. Service Level
What is Service Level?
Service Level measures the percentage of calls answered within a defined time threshold. It evaluates response speed against predetermined performance targets.
How is Service Level calculated?
Service Level = (Calls Answered Within Threshold / Total Calls) × 100
What are industry benchmarks for Service Level?
Service Level benchmarks measure call response time against predefined thresholds.
- Emergency dispatch systems maintain 90/10 standards (90% of calls answered within 10 seconds) due to urgency.
- Financial institutions adopt 85/20 benchmarks to meet SLA obligations and client sensitivity.
- Business process outsourcing firms follow 75/30 targets, balancing response efficiency with cost constraints.
- E-commerce platforms apply dynamic benchmarks, aiming for 80/20 during peak hours and adjusting during off-peak times.
How does Service Level impact business performance?
Service Level influences customer satisfaction and operational efficiency. Meeting 80/20 targets is linked to higher CSAT scores compared to 70/30 performance. It also indicates staffing adequacy and system readiness.
What strategies improve Service Level performance?
Workforce scheduling based on historical call patterns ensures agent availability during peak times. IVR systems deflect routine inquiries to self-service. Real-time monitoring allows immediate adjustments during volume surges.
5. Call Volume
What is Call Volume?
Call Volume measures the total number of inbound and outbound calls handled during a defined time period. It influences scheduling, service level targets, and resource allocation.
How does Call Volume impact business performance?
Call Volume analysis supports predictive staffing and capacity planning. High-volume periods require additional agents, while low-volume periods enable training and administrative work. Accurate forecasting improves service level outcomes and cost control.
What strategies optimize Call Volume management?
Historical analysis and predictive models improve forecasting accuracy. Automatic Call Distribution (ACD) systems support real-time volume tracking and routing. Workforce Management (WFM) dashboards display trends and predict future demand.
6. Customer Satisfaction Score (CSAT)
What is Customer Satisfaction Score?
Customer Satisfaction Score (CSAT) measures post-interaction customer sentiment using structured survey responses. It provides direct feedback on service quality and agent effectiveness.
How is CSAT calculated?
CSAT = (Satisfied Responses / Total Responses) × 100
What are industry benchmarks for CSAT?
Customer Satisfaction Score (CSAT) varies by industry based on service complexity and interaction context.
- B2B technical support centers report 85–90%, driven by personalized service and account-based support.
- Retail service channels maintain 75–80%, shaped by high contact volume and product return policies.
- Utility and government services average 70–75%, where interactions often involve billing, regulation, or limited flexibility.
- Hospitality and luxury brands frequently exceed 90% through high-touch service and customized support.
How does CSAT impact business performance?
CSAT scores correlate with customer retention and revenue growth. Organizations with 85% CSAT typically see stronger loyalty than those with 70%. CSAT also indicates overall service quality and operational performance.
What strategies improve CSAT performance?
Agent training enhances empathy and communication. Reducing wait times improves experience quality. Personalizing service through customer history access creates more relevant interactions.
7. Net Promoter Score (NPS)
What is Net Promoter Score?
Net Promoter Score (NPS) measures customer loyalty based on their likelihood to recommend a service. Customers rate this likelihood on a 0–10 scale, classifying into Promoters (9–10), Passives (7–8), and Detractors (0–6).
How is NPS calculated?
NPS = % Promoters − % Detractors
How does NPS impact business performance?
NPS reveals long-term loyalty trends and growth potential. Organizations with higher NPS typically retain more customers and generate more referrals, leading to increased revenue. It serves as a key indicator of customer loyalty and competitive position.
What strategies improve NPS performance?
Service standardization ensures consistent experience quality. Follow-up programs for detractors resolve concerns and reduce churn. These strategies rely on robust CRM systems and structured retention efforts.
8. Call Quality Score
What is Call Quality Score?
Call Quality Score evaluates agent performance using structured criteria defined by Quality Assurance (QA) teams. Evaluation factors include tone, accuracy of problem resolution, script adherence, and interaction quality.
How does Call Quality Score impact business performance?
Call Quality Score supports performance management and enhances customer experience. Organizations with structured QA programs achieve higher CSAT than those with minimal monitoring. The metric identifies coaching needs and drives performance improvement.
What strategies improve Call Quality Score?
Standardized scorecards ensure consistent evaluation. Real-time coaching delivers immediate feedback during interactions. Performance dashboards help agents track progress and focus on development areas.
9. Agent Occupancy Rate
What is Agent Occupancy Rate?
Agent Occupancy Rate measures the percentage of logged-in time that agents spend handling calls or completing related tasks. Optimal occupancy ranges from 75–85% to maintain productivity and agent well-being.
How is Agent Occupancy Rate calculated?
Agent Occupancy Rate = (Talk Time + After Call Work) / Total Logged-in Time × 100
How does Agent Occupancy Rate impact business performance?
Occupancy affects efficiency and workforce sustainability. Rates above 85% may cause burnout and higher turnover. Rates below 75% indicate underutilization and excess labor costs.
What strategies optimize Agent Occupancy Rate?
Balanced schedules distribute workload across shifts and teams. Planned breaks support recovery after high-intensity tasks. These practices rely on workforce management tools and real-time performance monitoring.
10. Cost per Contact
What is Cost per Contact?
Cost per Contact measures the average cost of handling a single customer interaction. It supports budgeting and ROI analysis for contact center operations.
How is Cost per Contact calculated?
Cost per Contact = Total Operating Costs / Total Number of Contacts
How does Cost per Contact impact business performance?
Cost per Contact influences profitability and operational efficiency. Lower costs—achieved through automation and process improvements—enhance competitiveness. The metric also informs technology investment and optimization strategies.
What strategies reduce Cost per Contact?
Self-service tools deflect routine inquiries from agents. Automated call routing reduces manual transfers. These initiatives require upfront technology investment but deliver long-term cost savings through reduced labor needs.
11. Agent Turnover Rate
What is Agent Turnover Rate?
Agent Turnover Rate measures the percentage of agents who leave within a given period. High turnover increases training costs, disrupts service quality, and lowers team morale.
How is Agent Turnover Rate calculated?
Agent Turnover Rate = (Agents Left / Average Number of Agents) × 100
How does Agent Turnover Rate impact business performance?
Turnover affects service consistency and operational stability. Organizations with 15% turnover retain more knowledge and deliver better service than those with 30%. Lower turnover reduces training costs and preserves expertise.
What strategies reduce Agent Turnover Rate?
Effective onboarding accelerates agent readiness and confidence. Recognition programs reward performance and improve workplace culture. Career development paths retain skilled agents through advancement opportunities.
What's the difference between a metric and a KPI in call centers?
Metrics and Key Performance Indicators (KPIs) differ in their strategic roles within call center performance management. A metric is any quantifiable data point collected during operations, such as activity counts or efficiency measures. A KPI is a selected metric directly aligned with specific business objectives.
Call Volume is a metric because it tracks activity without indicating quality or strategic impact. Average Handle Time is also a metric, measuring efficiency without directly linking to customer satisfaction or revenue. First Call Resolution becomes a KPI when tied to customer satisfaction as a core business objective.
Transforming a metric into a KPI requires three elements: alignment with a business goal, definition of measurable outcomes, and target setting. Organizations must define desired results, select influencing metrics, and establish performance benchmarks that support strategic priorities.
What are the different types of call center KPIs and how are they categorized?
Call center KPIs are categorized into distinct groups to enhance focus and enable targeted performance management across key operational areas. The three primary categories include Operational KPIs, Customer Experience KPIs, and Financial KPIs. Each category addresses specific performance dimensions and supports different decision-making functions within call center management.
Operational KPIs focus on process efficiency and agent productivity. These include service level performance, average handle time, agent occupancy rate, and call volume management. Customer Experience KPIs evaluate service quality and customer satisfaction using metrics such as CSAT, NPS, first call resolution, and abandonment rate. Financial KPIs measure cost efficiency and revenue contribution through metrics like cost per contact, agent turnover cost, and productivity-driven revenue analysis.
KPIs can also be categorized by timing into real-time and historical indicators. Real-time KPIs offer immediate performance visibility for operational adjustments. Historical KPIs support trend analysis and strategic planning.
How do call center metrics influence staffing efficiency, cost control, and customer outcomes?
Call center metrics directly support workforce planning by enabling data-driven analysis of staffing requirements, scheduling efficiency, and resource allocation. These performance indicators allow organizations to align agent availability with customer demand while meeting service quality standards and cost efficiency targets.
Staffing models rely on metrics such as call volume forecasts, service level targets, and agent productivity rates to determine optimal staffing levels. Historical call patterns inform predictive models that anticipate future resource needs. Service level performance guides real-time staffing adjustments to maintain answer speed thresholds.
Cost control efforts use multiple metrics to identify opportunities for expense reduction without compromising service quality. Improvements in First Call Resolution reduce repeat interactions and associated handling costs. Optimizing Average Handle Time lowers labor expenses by increasing agent efficiency. Reducing turnover through agent retention initiatives decreases recruitment and training costs.
Customer outcomes improve through metric-driven service enhancements and experience optimization programs. Higher Customer Satisfaction Scores correlate with increased retention and revenue. Net Promoter Score improvements expand referral opportunities and strengthen market positioning.
What tools and dashboards help monitor and analyze call center performance metrics?
Workforce Management (WFM) systems enable staffing optimization through predictive analytics and automated scheduling. These platforms combine historical call volume data with agent availability to generate efficient staffing plans. WFM systems track schedule adherence, break compliance, and productivity at both individual and team levels.
Customer Relationship Management (CRM) platforms consolidate customer interaction history with performance metrics to provide service visibility. CRM systems monitor customer satisfaction scores, interaction outcomes, and agent performance ratings. Integrated CRM capabilities support personalized service delivery and effective relationship management.
Quality Assurance (QA) dashboards facilitate agent performance evaluation using standardized assessment criteria and coaching workflows. These platforms record customer interactions, support structured evaluations, and track agent development over time. QA systems generate performance reports and provide coaching recommendations. Platforms such as NICE CXone, Genesys Cloud CX, and Talkdesk offer integrated workforce optimization, real-time adherence monitoring, and quality management features for call center operations.
Speech analytics tools process customer conversations to detect sentiment patterns, compliance issues, and service quality indicators. These systems automate quality monitoring and generate actionable performance insights. Speech analytics support trend identification and enable proactive service improvements.
How does root cause analysis improve long-term call center performance?
Root cause analysis improves long-term call center performance by identifying the underlying causes of recurring issues through structured investigation and corrective action. This approach focuses on resolving fundamental problems rather than addressing surface-level symptoms.
Issue identification relies on multiple data sources, including quality assessments, customer complaints, and agent feedback. Increases in Average Handle Time may reveal process inefficiencies, system limitations, or training deficiencies. Declines in Customer Satisfaction Scores prompt analysis of service delivery gaps and resolution effectiveness.
Structured investigation examines operational workflows, technology infrastructure, and training programs to identify performance constraints. Organizations document findings in formal analysis reports and implement corrective action plans. Quality Assurance reviews contribute detailed evaluations of agent interactions and behavior.
Customer feedback integration uses survey data, complaint records, and satisfaction trends to uncover service quality issues. By correlating customer input with operational metrics, organizations identify targeted improvement areas. Feedback analysis informs policy updates and service enhancement strategies.
What are the industry-standard benchmark values for key call center metrics?
Industry benchmarks provide reference values for performance comparison, although optimal targets vary by business model, service type, and customer expectations. Organizations should define performance goals based on strategic priorities rather than applying universal standards without contextual alignment.
Average Handle Time (AHT) benchmarks range from 240 to 600 seconds, depending on industry and interaction complexity. Technical support calls average 400–600 seconds due to troubleshooting needs. Sales calls range from 300–450 seconds to accommodate consultation and closing activities. Customer service interactions average 240–360 seconds for routine issue resolution.
First Call Resolution (FCR) benchmarks typically range from 70–75% across industries. Technology companies report 65–70% due to complex product inquiries. Financial services achieve 75–80% through standardized procedures and advanced agent training. Healthcare contact centers average 60–65% due to regulatory requirements and complex case handling.
Customer Satisfaction Score (CSAT) benchmarks fall between 80–85% across most sectors. Business-to-business services reach 85–90% through relationship-driven support. Retail averages 75–80% due to high contact volume and varied customer expectations. Technical support centers report 70–75% due to the complexity of problem resolution.
Service Level standards typically target 80/20 performance, meaning 80% of calls answered within 20 seconds. Emergency services follow a 90/10 model due to urgency. Business services often operate at 75/30, balancing speed and quality.
These eleven call center performance metrics serve as the foundation for measurable service quality, cost control, and operational efficiency. When aligned with strategic objectives and optimized using structured data analysis, they improve customer satisfaction, reduce agent turnover, and support scalable staffing decisions. As contact centers adopt AI-powered analytics and omnichannel tracking, these metrics will enable real-time interventions, proactive resolution workflows, and long-term service transformation.